Over the past few weeks, I’ve been putting together a series of posts on how to connect to the Power BI Rest API programmatically to extract inventory and usage data from the service.
Most of those posts (listed at the bottom of this page) are fairly long and technical — as, initially getting started using a program to read Power BI data via the API can be a bit much.
This post is going to be a bit different. Short and sweet. The payoff for all that hard work authenticating to Power BI, requesting data, downloading that data, and storing it in an easy to use SQL table.
With all of the hard work out of the way, its time to build a Power BI report to explore that great Activity Log usage data.
The Data
The report assumes you’ve followed the procedures in my previous post to download Power BI Activity Log data to a local SQL server (into a table named it.PBIActivityLog) as well as created a few other database objects.
While you don’t have to use the method/application described in the post to acquire the Activity data (feel free to put something together with the PowerShell cmdlet), you will want the SQL objects that store the data to ultimately end up formatted like that in the post to use this report for the queries to line up.
Scripts to create the database objects used by the Power BI queries are located here.
The Power BI Queries
It’s overkill for this report, but as a best practice in Power BI reports, I don’t typically query tables directly, but instead, query a view which then queries the table. This allows you to have a layer of flexibility in between the data and Power BI for simple data manipulation or controlling column names.
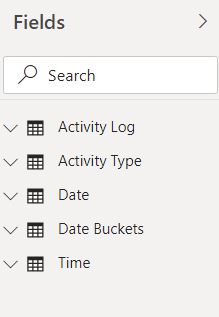
In these queries, I store objects in two database schemas — “dbo” is for general-use things that may apply to many things, like date and time. “it” is more specific to the IT department, which in this case is Power BI Activity Log data. In a small or empty database, the separation isn’t needed, but its helpful when more projects are stored in the same database. The Views/Queries:
- “Activity Log” – queries the it.vPBIActivityLog view, which refers to the it.PBIActivityLog table. This table is the storage for all of the Activity data received from the API. Some columns are the results of case statements in the transform and load stored pocedures and some columns, such as CreateDateKey, CreateTimeKey, and ActivityTypeKey are references to the tables below.
- “Activity Type” – queries the it.vPBIActivityLogActivityType view, which refers to the it.PBIActivityLogType table. This is a table I made based on the Microsoft listing of all activity types so I could intelligently group different types together into “view,” “delete,” etc. operations.
- “Date” – queries the dbo.vDimDate view, which refers to the dbo.DimDate table. This is a generic date dimension for calendar dates.
- “Date Buckets” – queries the dbo.ufnDateBuckets table value function, which generates a result set of dates with different tags (such as the dates that are the “Last 7 days,” the dates that are the “Last 30 days,” etc. I frequently use this as a slicer for allowing simple switching of time periods within a report.
- “Time” – queries the dbo.vDimTime view, which refers to the dbo.DimTime table. This is a generic time dimension for all times of day.
The Report
A picture is worth a thousand words, so let’s just dive into the report. This report isn’t complicated — no bookmarks or interactive buttons or drill-throughs. Just two pages, a summary and detail, to give an idea of what is possible when you start aggregating the usage data.


This report is intended to be simple and to help answer some of first questions that tend to come up about Power BI (“What reports are being used most and by whom?”). Feel free to use it as a template or inspiration for your own reporting to answer your specific questions about Power BI usage. More specific questions could easily create a need for a more complex report, which the data is there to support.
For information about how this data was gathered, see the earlier posts in this series.
Posts in Series
- Getting Started with the Power BI API – Querying Power BI with PowerShell
- Getting Started with the Power BI API – Querying the Power BI REST API Directly (with C#)
- Power BI On-premises Gateway Cluster Monitoring (Power Platform API)
- Power BI – Granting Permission to a Custom Application in Azure Active Directory (App Registration)
- Power BI API – Usage Monitoring – Activity Log (Audit Log) Activity Event Data
- Power BI API – Usage Monitoring – Tenant Usage Data with Power BI Activity Log (C# and PowerShell)
- Power BI API – Usage Monitoring – A Power BI Report for Tenant Usage Data