I attended my first Data Saturday, this past Saturday — Data Saturday #28 – Atlanta, GA. Data Saturdays are the successor to SQL Saturdays and this was the first one of those in Atlanta since the pandemic shutdowns of 2020.
Being the first event since the pandemic shutdowns, it was a smaller event than the mega events of the past, but that didn’t hinder its quality. The event was held at the Atlanta Station Microsoft office — my first time visiting this office (prior events were held at the Microsoft office in Alpharetta).
I appreciate the hard work of the organizers, volunteers, sponsors, and speakers and thank you for putting on a great event!
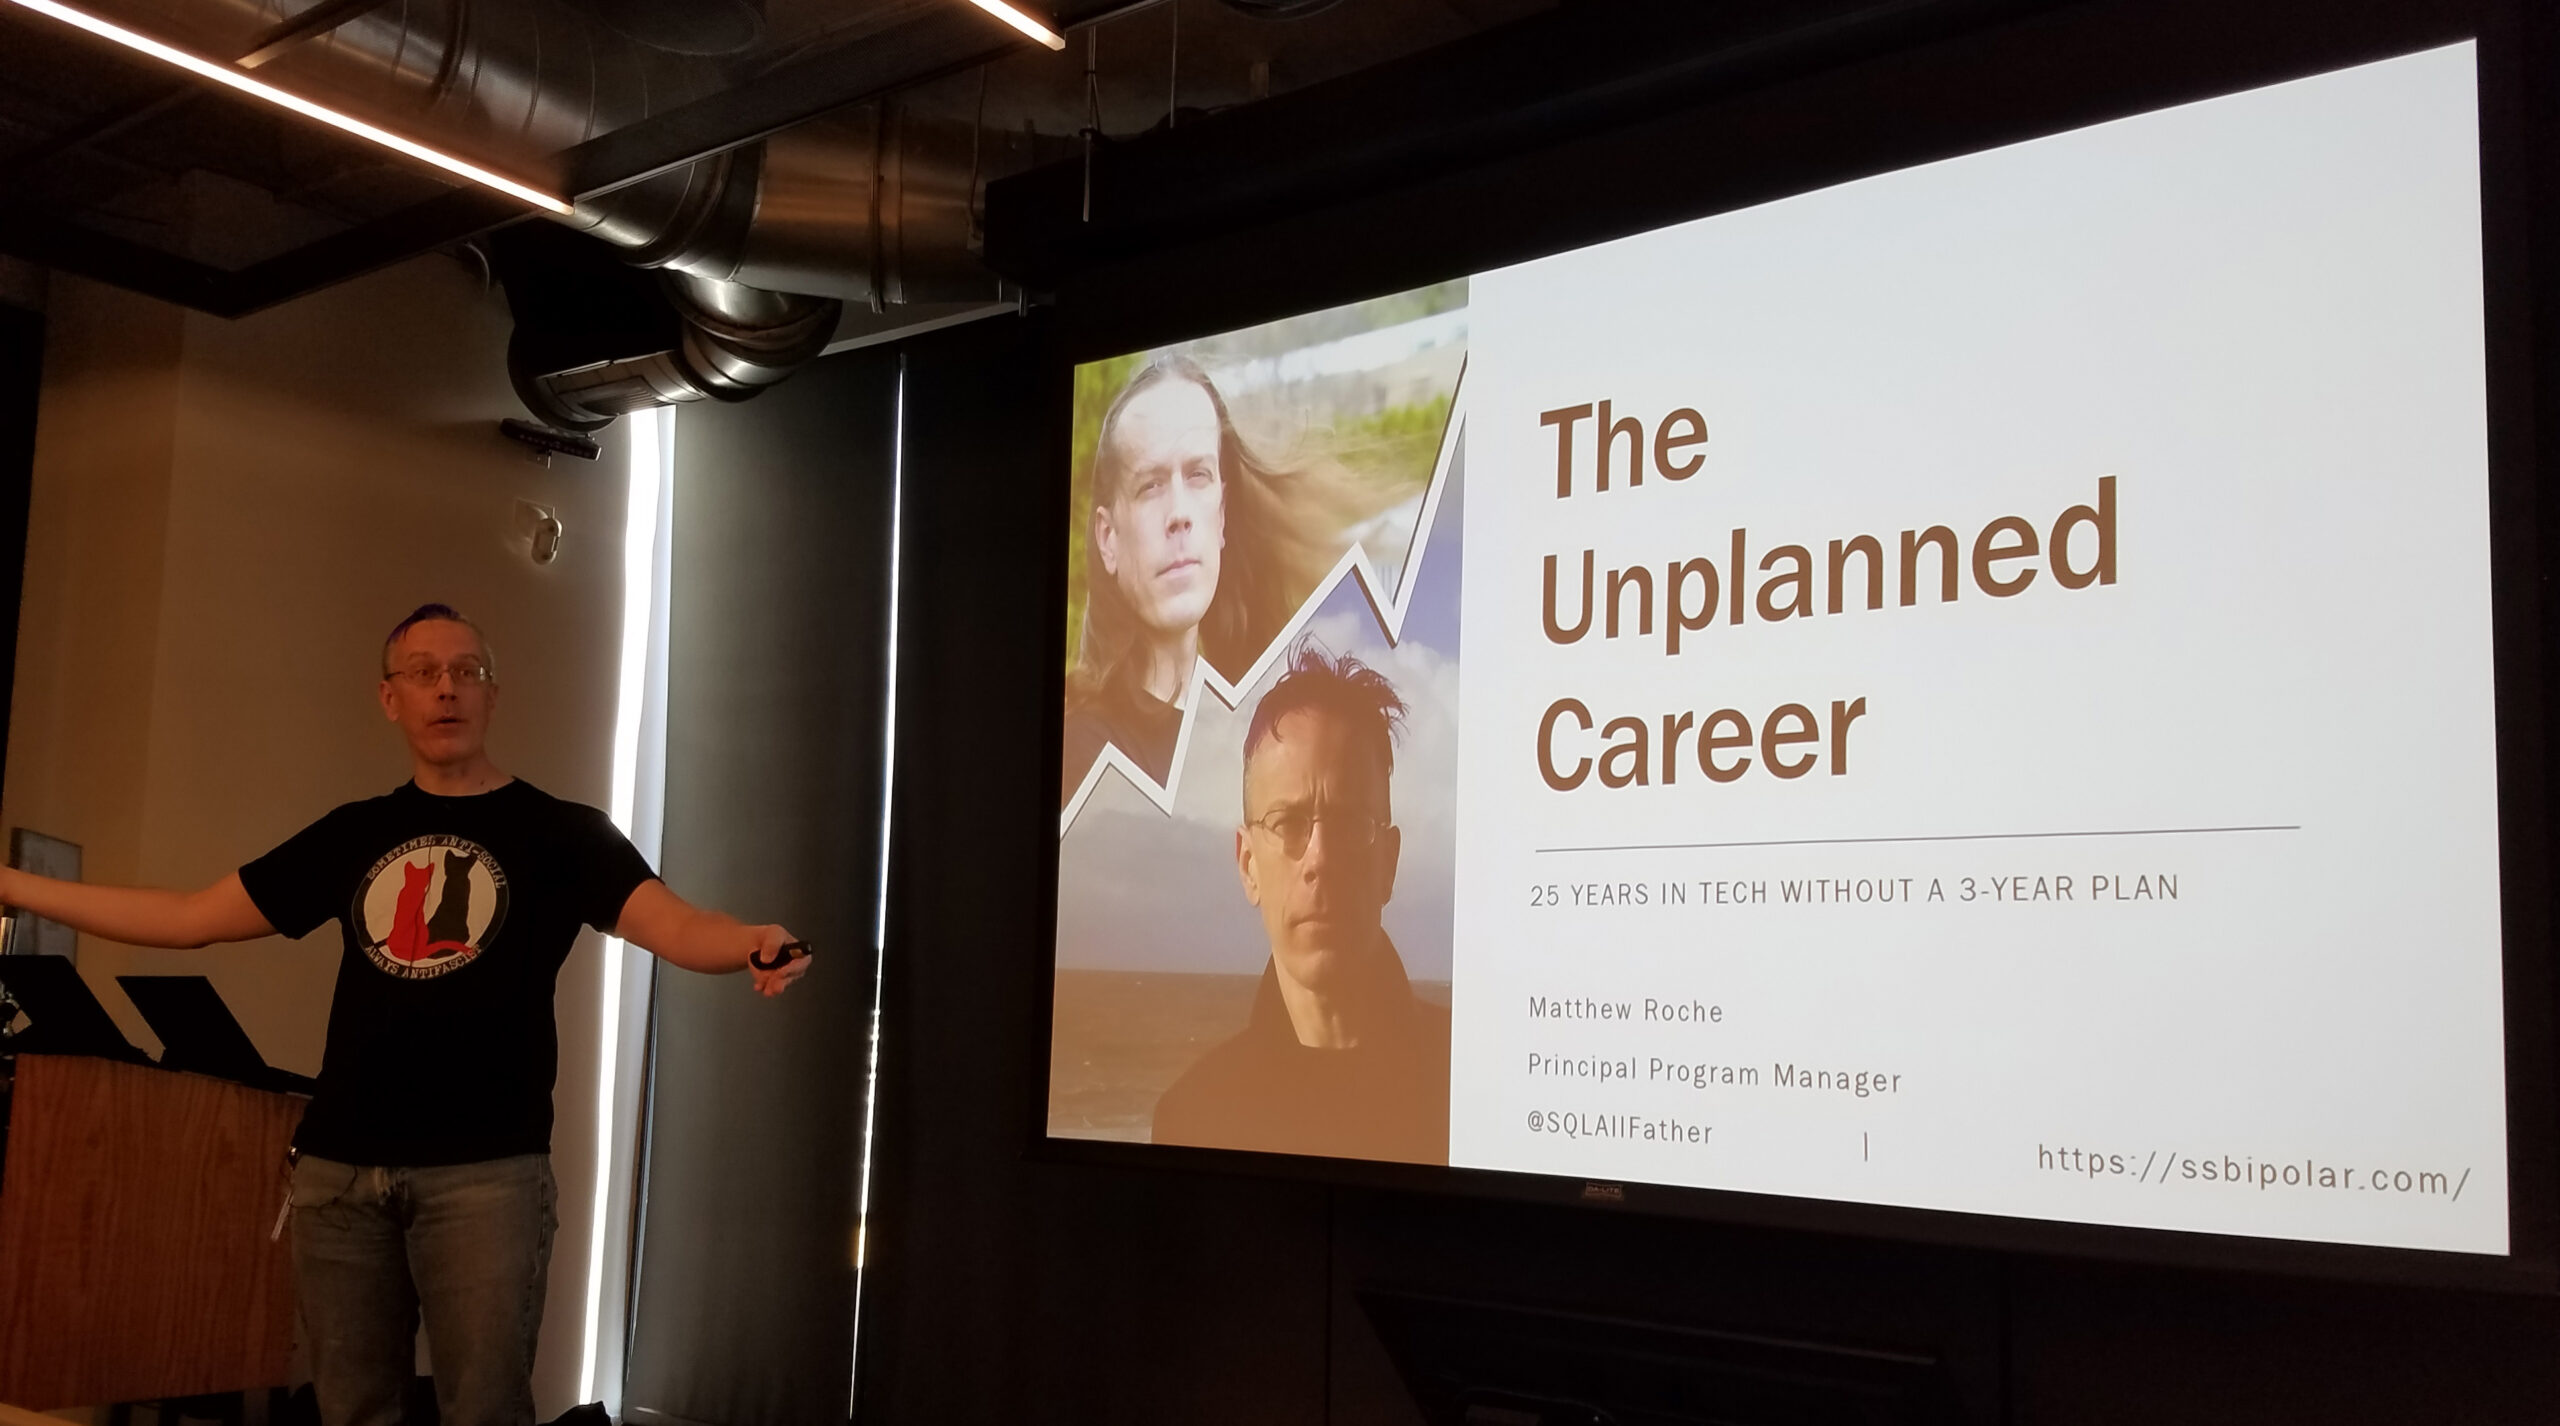
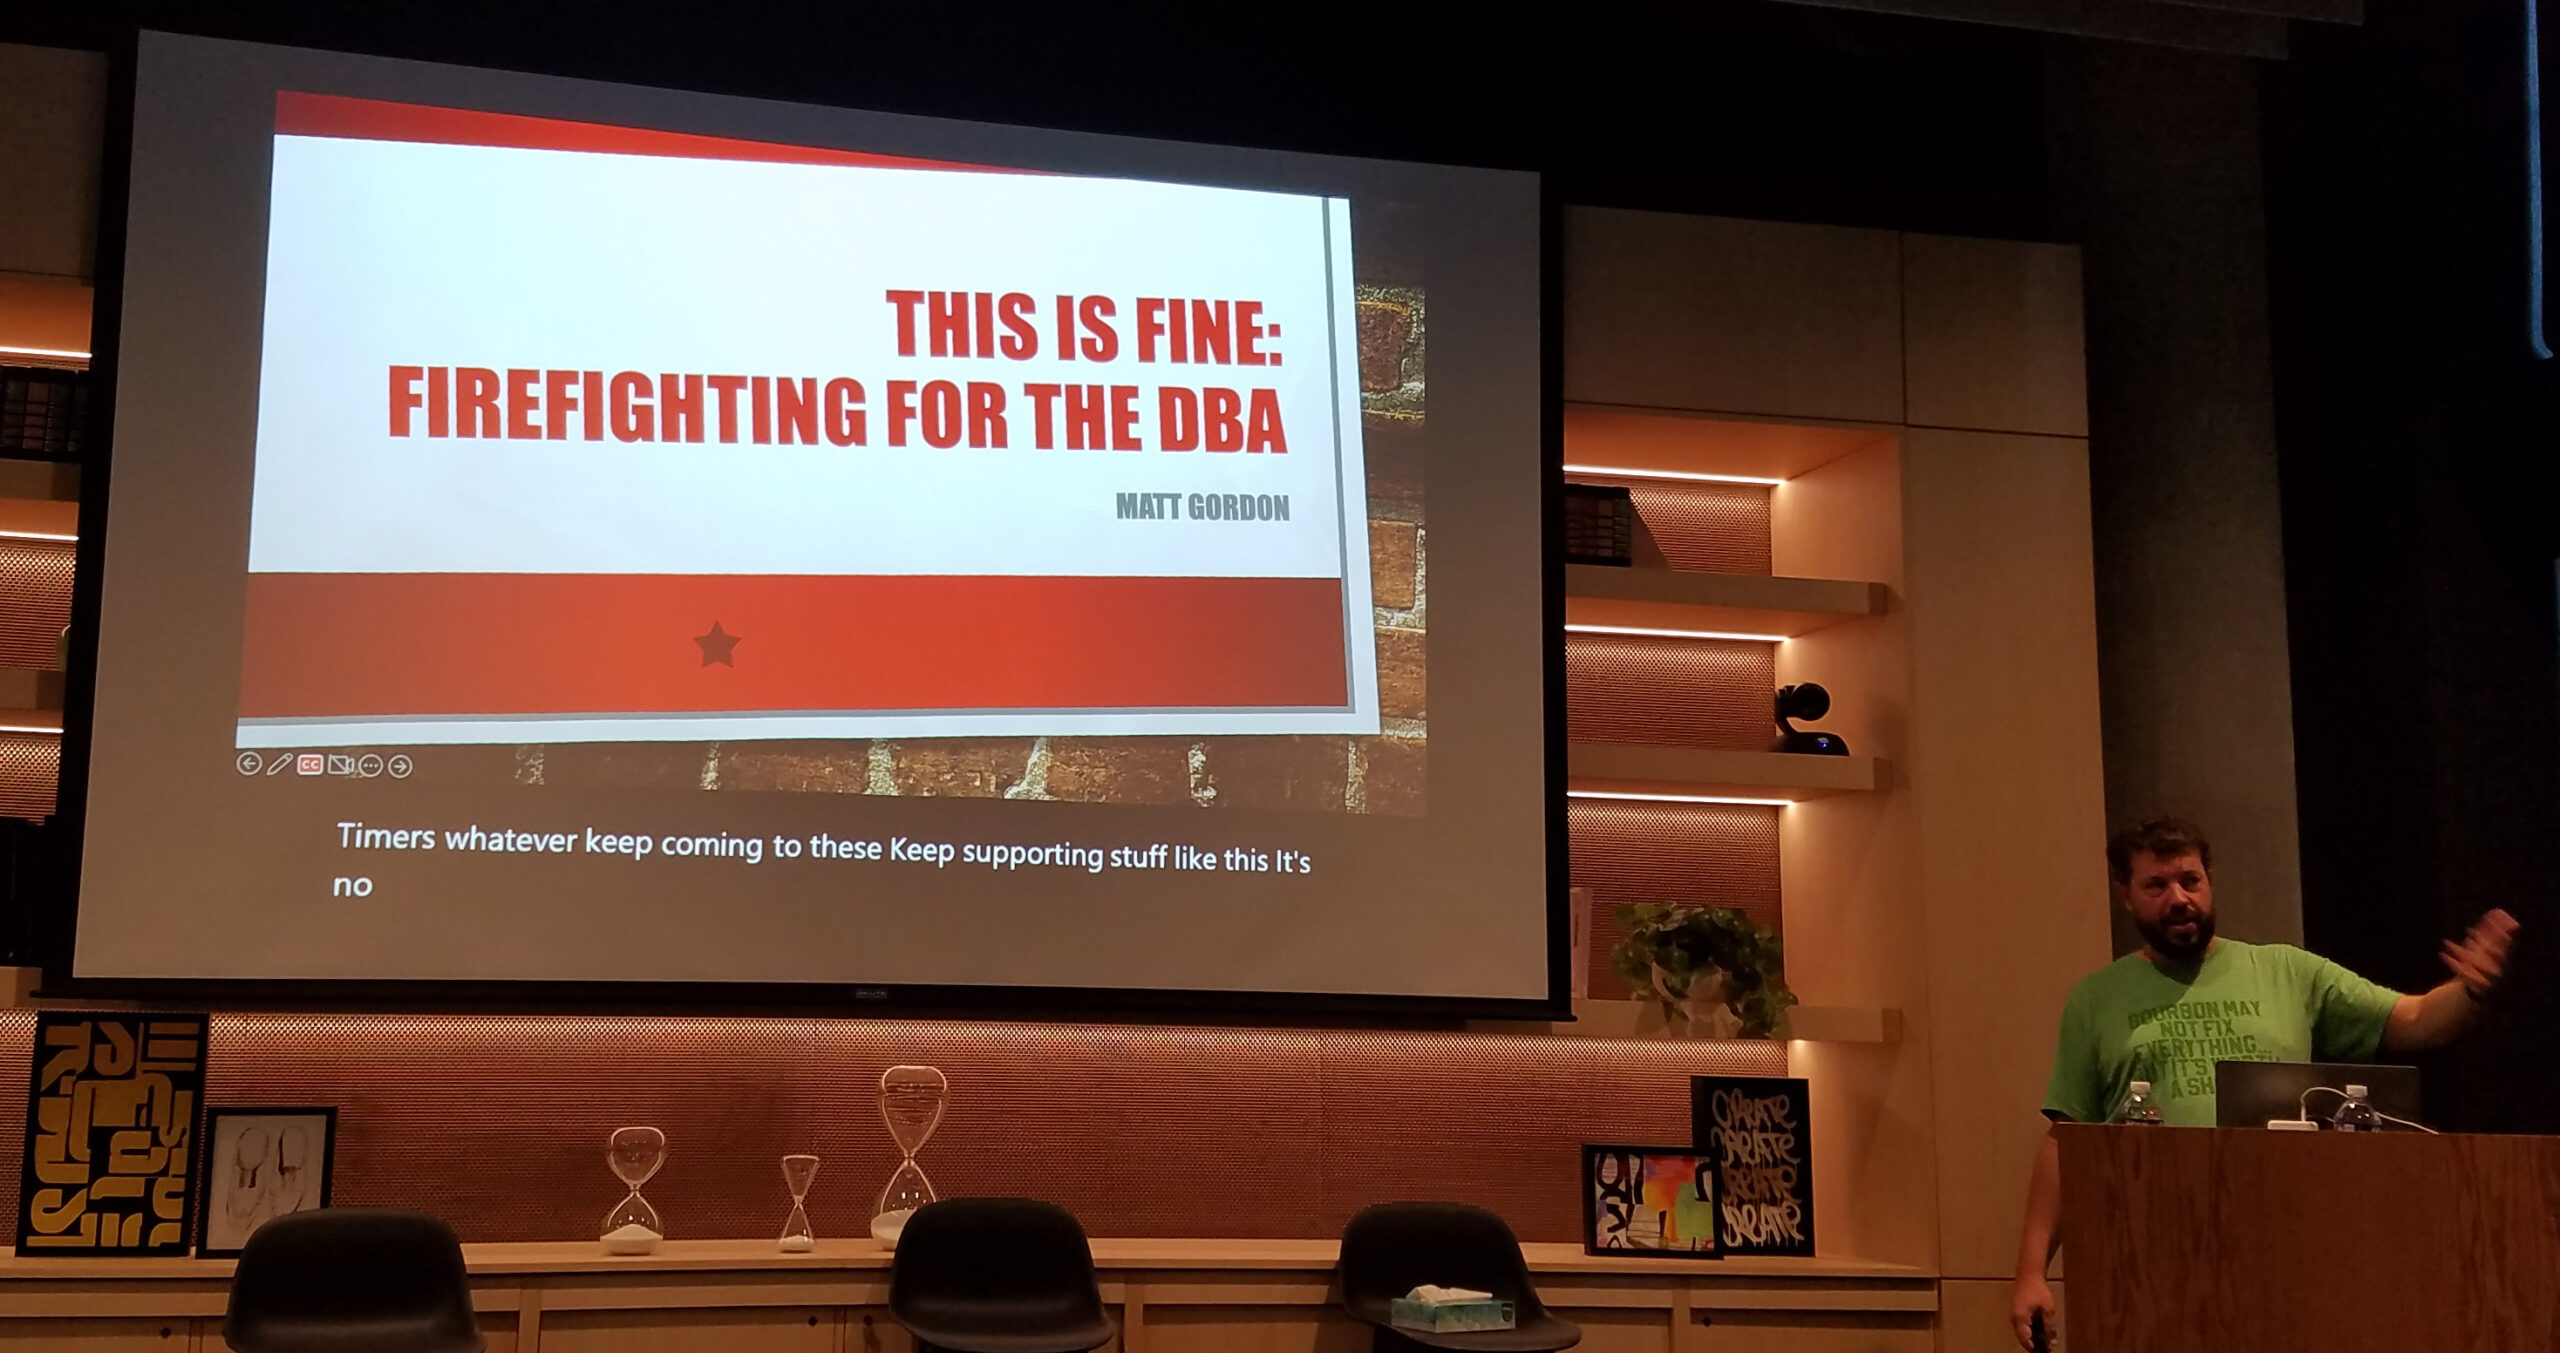
Matthew Roche presenting “The Unplanned Career: 25 Years in Tech Without a 3 Year Plan”Matt Gordon presenting “This is Fine – Firefighting for the DBA”Joey D’Antoni presenting “Understanding Azure Active Directory for Data Professionals”Tim Rayburn presenting “Help Your Teams Avoid Burnout and Apathy”
A common task for a report developer when learning SSRS and managing your first Reporting Services environment is to access the Report Catalog and ExecutionLog tables in the Report Server SQL database to extract report inventory and usage information.
For a long time, I’ve wanted to do something similar in Power BI — list all of my reports and which ones are used the most and least (and by whom) across all of my workspaces, but due to the nature of the Power BI Service (specifically not having a local and easily accessible juicy SQL database to mine for data) it’s been a much tougher nut to crack.
For some time now, Microsoft has made Power BI Usage data available through the Office 365 Audit Log, but this required special Office 365 permissions outside of Power BI to use. Just recently, however, Microsoft released the Power BI Activity Log, which is a Power BI specific interface into the Office 365 Audit Log data which pertains to Power BI. This means that only Power BI (Service Admin) privileges are needed and the data can be accessed via the Power BI PowerShell cmdlets or via the Power BI Rest API!
When using the cloud-based Power BI Service, powerbi.com, every action that is taken while logged into the portal — whether it is viewing or publishing a report, creating a new workspace, or even signing up for a pro trial license, that activity is logged within the Microsoft servers as part of the Office 365 audit logs.
Accessing these logs can be accomplished via a couple of different methods (either through the Office 365 Audit Log functionality using the Office 365 Admin Center or PowerShell cmdlets; or through the new Power BI Activity Log (Power BI Get Activity Events) functionality accessible via a PowerShell cmdlet (Get-PowerBIActivityEvent) and an API). There are a few examples out there already on how to use these commands to access the data (and I have a post on accessing the data using the Power BI API and C# coming out in a few week), but there doesn’t seem to be a lot out there about the data itself, which is what I plan to focus on here.
The Power BI Service, available at powerbi.com, utilizes Azure Active Directory to handle its authentication. This is important to know for creating a custom Power BI application (in any language — C#, Python, etc.) that reads and write from the Power BI REST API. The one exception to this would be using the Power BI PowerShell cmdlets, as they internally, use their own registration mechanism.
This post rehashes and elaborates on the information I touched on in this post, but I wanted to have a dedicated post on just this topic that I could link back to.
So, what is an App Registration? An App Registration is an entry in Azure Active Directory that lets Azure Active Directory know that you will be using a custom application and associates permissions to that application. Additionally, with the addition of permissions, it associates the application to the Azure Active Directory Resource (aka https://analysis.windows.net/powerbi/api). When your application connects to Azure Active Directory, it provides an Application ID (a GUID generated during the registration process) and some form of authentication. Depending on the type of application, the authentication might be user credentials (Delegated Permissions) or a Client Secret or Certificate (Application Permissions).
In what has become a yearly tradition, I attended my first SQL Saturday of the year in Nashville — SQL Saturday #933 — Nashville, TN, which took place on Saturday, January 18th, 2020. As with prior years (I’ve attended 4 of their 7 now) the event was well worth the drive from Atlanta.
While the weather wasn’t great (cold and rainy) at least it wasn’t snowy and icy like we’d had in previous years. Fortunately, the entire event takes place indoors — so the cold and gloom outside was easy to ignore with all the action inside. The schedule this year, as usual, was made up of a ton of great options and all of the speakers were fantastic. Lunch in Nashville is always a treat — hot and delicious BBQ and everything was well run and professional.
I had a great time at the event and look forward to attending the 10th anniversary next year!
Morning registration at SQL Saturday 933 – NashvilleContinue reading
With fall in the air and pumpkins and skeletons making an appearance, the third Saturday in October was the day for something else to make an appearance the annual SQL Saturday BI Edition for Atlanta, GA.
For the third consecutive year, I was fortunate enough to have the opportunity to attend the BI Edition of SQL Saturday, which was held conveniently nearby — once again at Alpharetta Microsoft office.
With the Atlanta events, it’s pretty easy to take for granted how well run they are. Registration was a snap for those with pre-printed SpeedPasses, GuideBook was available for keeping a copy of the schedule handy, and the venue offered just enough room (with one exception — a jam-packed session by Patrick LeBlanc) for all of the sessions.
The schedule was a good mix with plenty of great picks throughout the day and the whole event had the usual well-run feel to it. For anybody that hasn’t attended this event (or the May event) before, you should definitely look into the next one!
As always, I’m thankful to the organizers, speakers, sponsors, and great attendees for a fantastic and well-spent Saturday and look forward to the next!
Reza Rad presenting “Architecture Blueprints for Power BI Implementation.”Ed Watson presenting “The Psychology of Better Power BI Reporting.”Patrick LeBlanc presenting “Data Modeling and DAX Tips for Power BI” and “Power BI Performance in 6 Demos.”Shabnam Watson presenting “Aggregations in Power BI.”Raise your hand if you learned something today at SQL Saturday.Outside the venue at lunch, in the rain, some event or filming was taking place as one street of the Avalon outside of the Microsoft building was lined with these amazing machines.A whole lot of money parked along this street. Might’ve been cheaper to actually pave the street with gold.
In my previous article, I covered creating geospatial SQL Server tables using the freely available Natural Earth resources. Natural Earth is an extensive public domain map dataset available at 1:10m, 1:50m, and 1:110 million scales in vector and raster data formats which can be used as an alternative to ESRI Shapefiles for geospatial data. In this article, we’ll be creating a simple SQL Server Reporting Services report which utilizes this spatial data in lieu of the more commonly used shapefiles to plot data on a custom map.
To get started, we’ll first need to create some assets. Follow the steps in the previous article to setup the Natural Earth tables. Next, we’ll create some views to simplify queries, then we’ll create a report using these assets as well as some sample data.
SQL Server Reporting Services (SSRS) has excellent geospatial support for displaying data on a map. Maps are typically created using ESRI Shapefiles (.shp files). These Shapefiles are typically created with complex GIS software and made available for download (sometimes free and sometimes not) to be used. Additionally, SSRS has an excellent default set of Shapefiles built in for the US which can show the country, states, and individual counties.
Example of SSRS Shape File showing Georgia and its 159 counties.
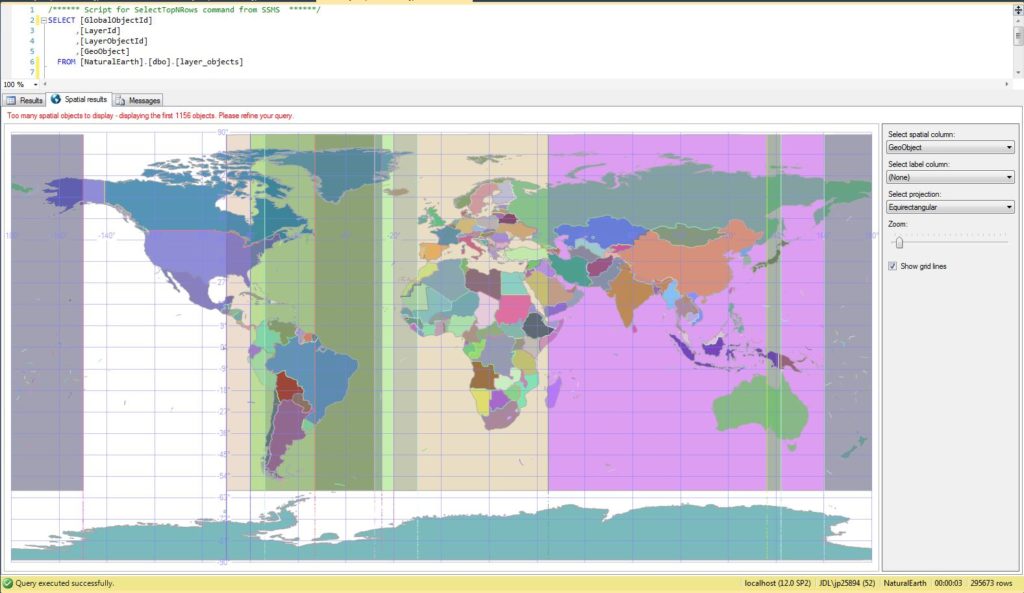
But what about when you need more flexibility in your geographic display? Some examples of this may be wanting to display something that you can’t find a shape file for (maybe all the states and provinces in North America) or maybe you want to dynamically draw the geography based on some property of the dataset. Geospatial data queries to the rescue! Using SQL Server’s native geospatial support, a geospatial query can be created to return something as simple as a point or rectangle, or complex as the geography of an entire country and all of its rivers.
Getting all of the latitude and longitude coordinates to create a useful geospatial query could potentially be an enormous amount of work. Fortunately, that work has already been done in a freely available resource, thanks to Natural Earth and Laurent Dupuis. SQL Server 2012 or greater is recommended for this process.
Example of a geospatial query, shown in the SSMS results pane, based on the imported Natural Earth data.
Recently, I had the opportunity to participate in the beta period for the new Microsoft 70-768, “Developing SQL Data Models” exam. As part of the development process for new exams, Microsoft periodically offers invitations to take a beta version of the exam free of charge. Passing an exam while in the beta period results in passing the test officially when it is released. However, there are a few catches to this. The first of which is that these betas are designed to be taken by people who already have knowledge of a subject and work with it on a regular basis. Since the exam is brand new, there are no official study materials to study, and there is typically a short window of time between the announcement and close of the beta period, so there isn’t a lot of time to prepare. These exams also aren’t for those that feel the need for instant gratification, as it may take a month or longer to receive score results to ultimately find out if you passed or failed. But, the wait is for a good cause as the beta exams are used to determine the final versions of the exam as well as passing scores, which must be completed before the beta exams can the go through the scoring process to be officially scored.
For those interested in taking a beta exam and qualified to do so, I’ve found that Microsoft usually announces the availability of a limited number of seats via the Born to Learn blog which are available until the allocated number of exams are scheduled. For this last batch of SQL Server beta exams, 300 seats were made available for each exam. This may sound like a lot, but this is worldwide, so you have to act fast. I’ve found that if you don’t act within the first day or maybe two of the announcement, you will probably be too late. Once announced, you typically have to have the exam scheduled in a proctored environment within around a month of the announcement.
Like all Microsoft certification exams, the beta exams are covered by an NDA protecting the exam content, so I won’t go into exam specifics, but I do have a few general thoughts about the exam and process. It is interesting to see how the Microsoft exams in general have changed and matured over the years.
I’d classify this exam as “tough, but fair” with a heavy amount of reading. I underestimated the amount of reading, and was thoroughly exhausted at the conclusion of the exam.
Due to the length of the questions and answers, and re-reading questions and answers, I used almost all of my time allocated for the exam.
The published Exam Objectives were very representative of the exam content (shockingly so) and make a very good framework for preparing for the exam.
How an exam is scored is always a black box, but some questions do make mention of how they award partial credit, such as “1 point per part of correct answer” which I found to be a welcome change — nice to know for sure that partial credit is at least possible in some cases.
The test engine itself is new since the last time I took an exam and seemed to work well with one exception. An exam may be made up of a combination of “reviewable” questions in which you can go back and “non-reviewable” questions in which you cannot go back. I’m sure there’s an intelligent reason for this. The way the engine handled this, however, is to go through the reviewable questions first, then allow for the standard review and change process, then proceed to the non-reviewable questions with the remaining time — only it really didn’t do a good job of explaining this process. Instead, I saw the question count, such as “50 out of 60,” hit next, then it proceeded to the review screen, which I thought was a glitch in the question count, no big deal…so I spent a bit too much time reviewing, only to have it launch into the next set of questions with not much time remaining once I finished review. It’d work a bit better if the non-reviewable questions came first or it gave a can’t-miss screen of explanation to allow for better budgeting of time.
The question types are made available here . Not all types will necessarily be present in all exams and the Build List is definitely a type to be very familiar with, as it seems quite popular.
I’m currently eagerly awaiting my results, and probably will be still for some time as the beta period has just closed. Should I not pass, I look forward to attempting it again, possibly in the new online proctored format, which I’m curious to try out.
Recently, I experienced an issue trying to get a new installation of Microsoft Excel 2016 to connect to SQL Server 2014 Analysis Services Multidimensional. Whether I would try to connect directly from Excel, via the “From Other Sources” menu or via the Cube Browser in SQL Server Management Studio, I would receive an error that Excel was unable to connect to the database.
I verified that the service was running, firewall not blocking it, and credentials good. Read on for the solution to this issue.


 In my previous article, I covered
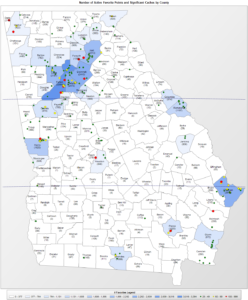
 Recently, I had the opportunity to participate in the beta period for the new Microsoft