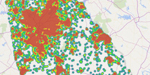
 Power Map (for Excel), part of Microsoft’s Power BI suite of tools, provides a very fast and effective way to visualize large amounts of geospatial data on a map. In an effort to visualize the density of Geocaches placed in the state of Georgia, I created a Power Map visualization of all current placements. This visualization showed a high density of geocaches in northern Georgia (which is consistent with population distribution) as well as other major cities, such as Augusta, Savannah, Macon, and Valdosta.
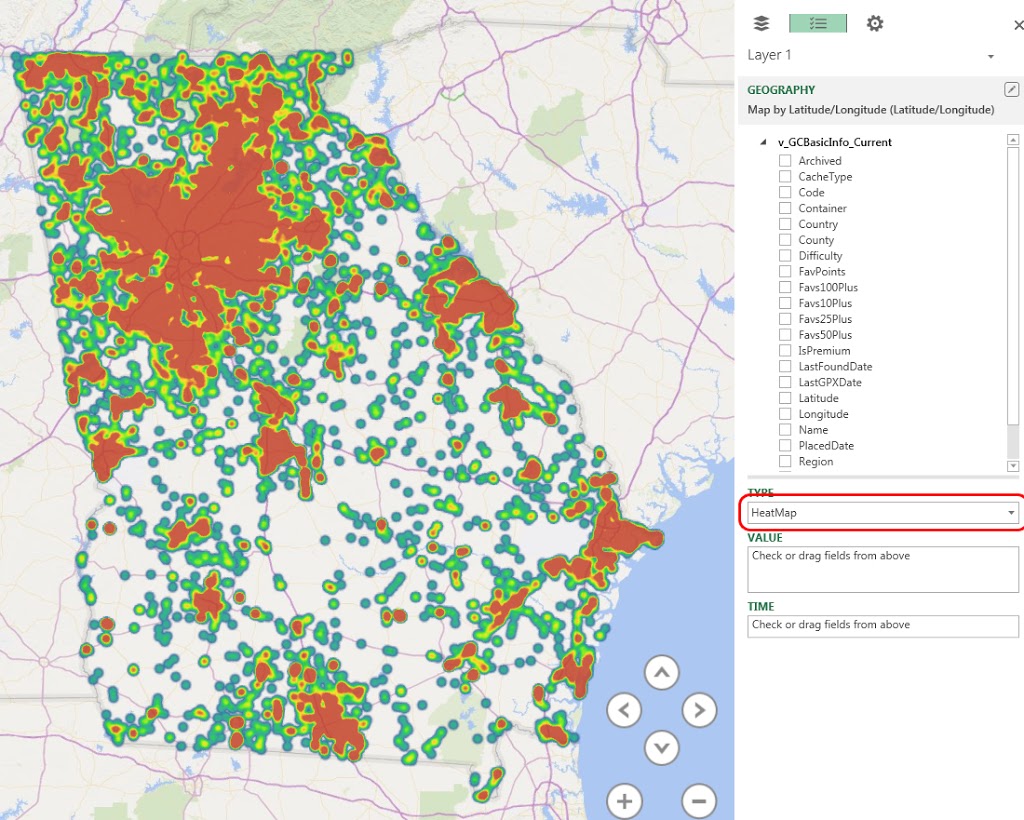
Power Map visualization of Geocaches placed in Georgia
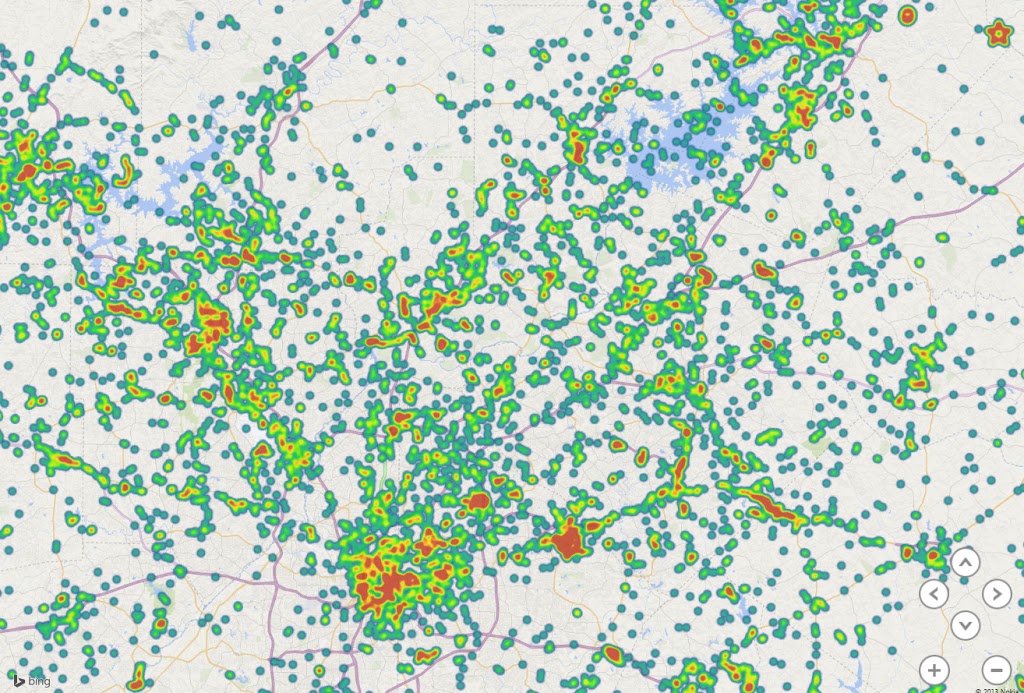
Power Map visualization of Geocaches placed in Northern Georgia