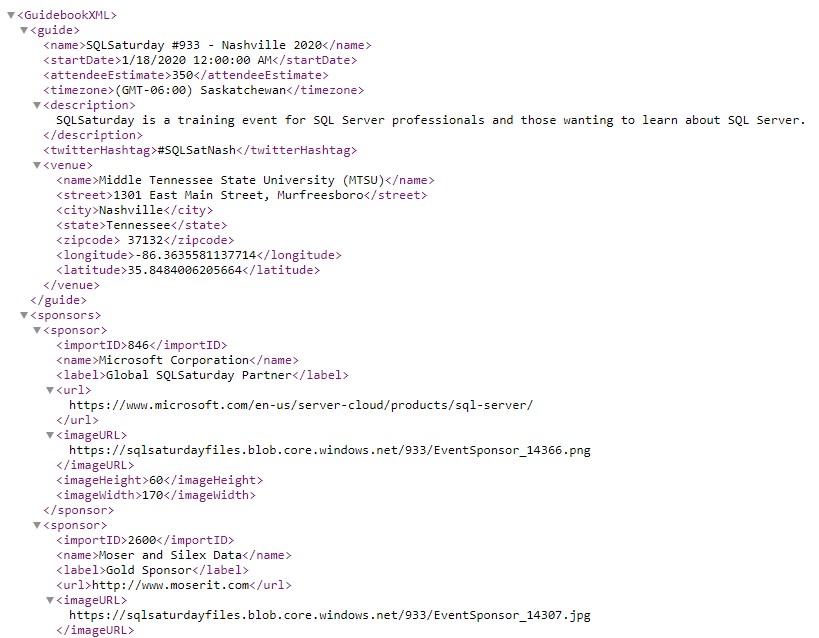
Data for SQL Saturday events is maintained via the sqlsaturday.com website. The site makes available an XML feed for each event which includes all of the basic information for the event, including information about the event, venue, sponsors, speakers, and sessions. The data is available freely from the SQL Saturday website without the need to log in or authenticate to the site.
While getting data for an individual event is pretty straightforward (thanks to the handy XML file), there are some nuances to the process and the data which complicate things somewhat.
The SQL Saturday Website Upgrade
The most notable factor is when the event occurred relative to the SQL Saturday website upgrade. The website upgrade went live at the beginning of April, 2015. For events that were created and occurred before this time, their data would need to be upgrade or recreated in the new site (I’m not sure what process they followed, but it was not smooth for historical events). For anything post-upgrade, those events would natively exist in the new system, so the data will generally be better and more complete.

XML Data from events which were migrated to the new site is available via the XML feed on the new site, but some data is missing/incomplete (mostly around schedule data). To enhance the quality of these events, I made use of a data export that was taken well prior to the upgrade (probably September or October of 2013) and augmented the existing data with that to fill in some gaps.
Getting Data for All Events
The second consideration when getting data for SQL Saturday events is how to get data for all events. The SQL Saturday website makes data available for a single event only. To get data for every event, you must request every event. Generally, this means implementing a loop to loop through every event, importing the data for each event into a database.
Fortunately, event numbers are predictable (they are an integer value which starts with 1 and increments by 1 as each event is approved). Additionally, the URL which is used to retrieve the event data uses the event number. The URL can be found thanks to a button on the bottom of a SQL Saturday event page.

SQL Saturday XML Feed URL: https://www.sqlsaturday.com/eventxml.aspx?sat=x
(where x the actual event number, currently 1 through 1002 or so)
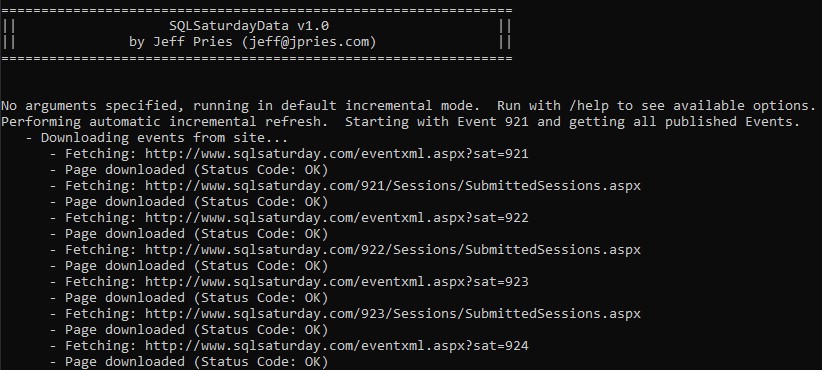
The process I use in my application to get the data is to start getting data at event 1 and continue incrementing and getting data until I reach a certain number of blank responses in a row — this lets me know when I’ve reached the end of the events. Then, on subsequent requests for data, I only request recent and future events to minimize the amount of data requested.
Augmenting the Data
While the data received via the XML feed is pretty good, I wanted to add to it as well. I augmented the data via the following:
- For each event, I perform a Bing Maps API geolocate on the event venue address to standardize it and get the latitude and longitude (map visuals will be more accurate and its possible to do more geospatial functions in the future)
- For each event, I get the total count of sessions submitted via the https://www.sqlsaturday.com/x/Sessions/SubmittedSessions.aspx page (parsing the value out of the HTML).
- I added a table to track which events I’ve personally attended (which I manually update).
- I added a table to track which sessions I’ve personally attended (which I manually update).
- During ETL, I create two association tables to handle many-to-many relationships (Event Sponsors and Session Speakers)
- During ETL, I add surrogate keys to each table and have the joins between tables use these (to avoid composite keys and make Power BI happy).
Cleansing the Data
The data coming directly from the XML files is decent, but also could benefit from a little cleanup. Notably:
- Occasionally, bad data in the XML files can cause issues reading the files. Most frequently, these are HTML tags (line breaks and hyperlinks being most common) which can confuse the XML parser. I search and replace for known error conditions and replace them with safer strings.
- Event location data isn’t always standardized. The Geocoding process mentioned above does a great job of fixing this as it returns standardized city, state, country, zip information as well as latitude and longitude coordinates.
- Duplicate sponsors listed in the sponsor data. Sponsors are listed multiple times (as they are per-event) and sometimes have minor variations in their names. I do my best to de-duplicate these without getting into fuzzy matching.
- Inconsistent sponsorship levels in the sponsor data. There are many, many sponsorship levels in the data. Too many for any meaningful charting. I do my best to bin similar sponsorships together as common names to reduce the total number of levels to a manageable number.
- Duplicate speakers listed in the speaker data. Much like sponsors, speakers are listed multiple times (as they are also per-event) and sometimes have minor variations in their names. I do my best to de-duplicate these without getting into fuzzy matching.
- Inconsistent tracks in the session data. Much like sponsorship levels, there are many, many tracks in the session data. Too many for any meaningful charting. I do my best to bin similar tracks together as common names to reduce the total number of tracks to a manageable number. Despite my efforts, “Other” is still the most common track.
Data Acquisition and Refresh Process
I pull everything together with a combination of a C# console application as well as SQL Server stored procedures, database tables, and views.
The C# console application is run from a command line. It can be run with option command line parameters or in default mode. In default mode, it will first look up the last events it knows about and will begin getting data for events that started within the last week or were scheduled to start after the last time the data was refreshed. If it doesn’t know about any events, it’ll get everything.
For each event, it’ll download the event XML file and an HTML file containing the number of events submitted. Each of these are parsed and loaded to SQL database tables. The program then looks at events that have not yet been geocoded and performs a Bing Maps API request to geocode the event and saves the results back to the table. To use this feature, you’ll need a free Bing Maps API Key available from here. Add this value to the application’s .config file before running it to refresh data.
After loading all of the data, the program kicks off the Stage (Transform) and Load stored procedures to fully transform and key the data. These typically update the data via SQL merge statements. Finally, the data is ready to be accessed via a number of SQL views.
Power BI Data Model
After getting the data and running it through the full ETL process to get it as presentable as possible, I bring it into Power BI making use of SQL views. Each of my main tables has a view associated with it. My main tables in the Power BI Model are:
- Event
- Sponsor
- Session
- Speaker
I have two association / bridge tables to handle my many-to-many relationships:
- Event Sponsorship
- Session Speaker
Finally, I have two tables pertaining to dates — one true Date Table and one that handles a custom date slicer (very similar to the Power BI Relative Date Slicer, but a little more friendly):
- Date
- Date Buckets
Putting it all together, I created the following model diagram for the relationships between the tables.
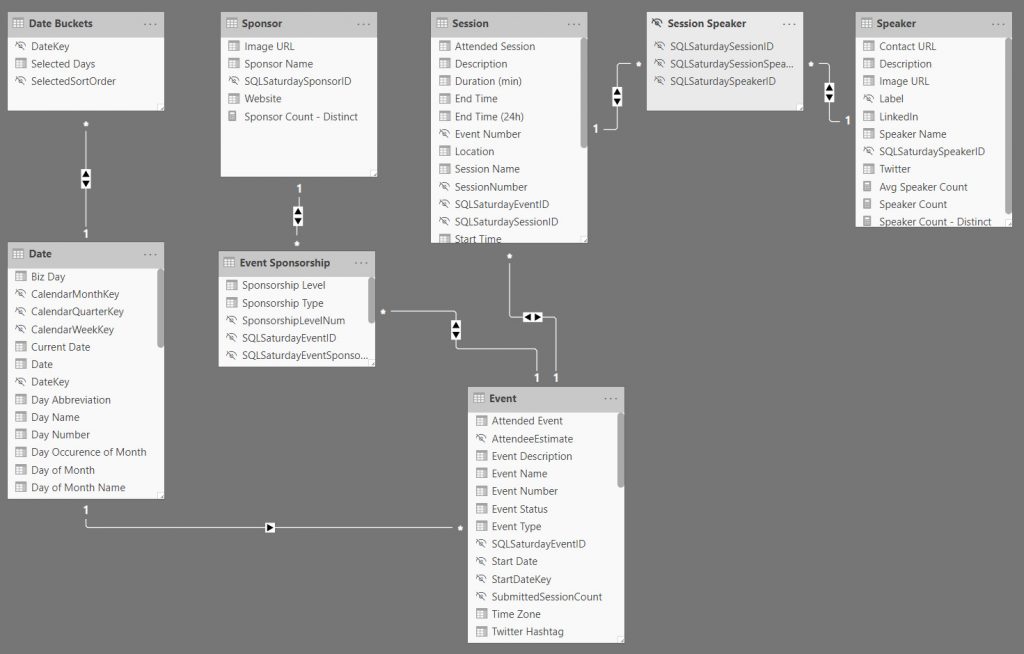
When looking at the diagram, you first might say “wow…that’s a lot of bi-directional relationships!” and you’d be right. But, let me defend myself!
- In terms of data quantity, this is a fairly small data model and it always will be.
- There won’t be any new tables added to it to create potential circular paths or add additional complexity.
- In the reporting, each of the four main tables — Event, Sponsor, Session, and Speaker each can function as the main subject for a report page (using data from one or more of the others as attributes)
Having solid data in place with a functional data model, I was finally able to create measures within Power BI and get to visualizing the data, which I talk more about in my previous post in this series, “Exploring SQL Saturday Data – A Power BI Analysis.”
Resources