Geocaching Analytics – Part 5: GCInsight Visualizations with SSRS
Continuing our journey of analyzing Geocache data with various visualization tools, we arrive at SQL Server Reporting Services (SSRS). SSRS is a server-based SQL Server component used for generating static (and generally printer friendly) reports.
Aside from its cost (free), one of the greatest benefits of SSRS is the ease of use in getting started with report creation.
This post won’t cover the installation and configuration of the server-based components of SSRS (there are plenty of resources out there on the Internet and the process varies based on your version and edition of SQL Server). At its core though, it is made up of the following components:
- A SQL Server Reporting Database which stores information used by SSRS, including connection information and reports. This database is initially created by the installation and is managed by the product.
- The Report Server and Report Manager services, which are the core service behind Reporting Services as well as a web server (running either natively or inside of SharePoint) which allows for the access and administration of reports and report components.
- Design Tools such as Report Builder and SQL Server Data Tools (Visual Studio)
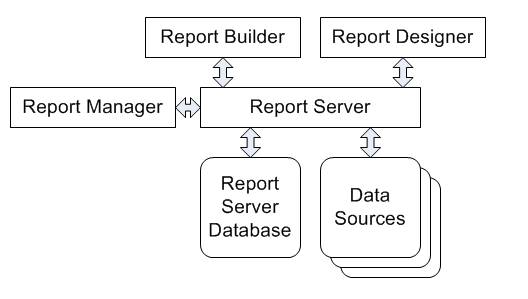 |
| SSRS conceptual diagram. Source: http://www.accelebrate.com/library/tutorials/ssrs-2008 |
Going into the inner workings of SSRS and report development can go down the rabbit hole of complexity very quickly, so we’ll stop there. A quick summary is that report design tools create report files which are stored inside of reporting services and can then be accessed via a web browser. As we’re interested in geocaching visualizations, we’ll be focusing on the content created within the report design tools.